Last active
May 15, 2022 02:18
-
-
Save mohanson/661b22c18e681a508f07ba04e5ce428a to your computer and use it in GitHub Desktop.
matplotlib.ipynb
This file contains hidden or bidirectional Unicode text that may be interpreted or compiled differently than what appears below. To review, open the file in an editor that reveals hidden Unicode characters.
Learn more about bidirectional Unicode characters
| { | |
| "metadata": { | |
| "kernelspec": { | |
| "name": "python", | |
| "display_name": "Pyolite", | |
| "language": "python" | |
| }, | |
| "language_info": { | |
| "codemirror_mode": { | |
| "name": "python", | |
| "version": 3 | |
| }, | |
| "file_extension": ".py", | |
| "mimetype": "text/x-python", | |
| "name": "python", | |
| "nbconvert_exporter": "python", | |
| "pygments_lexer": "ipython3", | |
| "version": "3.8" | |
| } | |
| }, | |
| "nbformat_minor": 5, | |
| "nbformat": 4, | |
| "cells": [ | |
| { | |
| "cell_type": "markdown", | |
| "source": "# 如何使用 Matplotlib 绘制令人赏心悦目的图表", | |
| "metadata": {}, | |
| "id": "2622776b-dd92-4b76-a9a7-f8e0752c1fc8" | |
| }, | |
| { | |
| "cell_type": "markdown", | |
| "source": "## 从美国 GDP 数据开始\n\n有一天我在我的知乎上刷到了这个问题: [2022 年美国第一季度经济折合年率萎缩 1.4%, 还有哪些信息值得关注? 或受哪些因素导致?](https://www.zhihu.com/question/530511433)\n\n问题的信息源是**财联社**:\n\n> 美国 2022 年第一季度经济折合年率萎缩 1.4%, 预估为增长 1.1%, 前值为 6.9%.\n\n上面这句话似乎给了很多信息, 1.4%, 1.1%, 6.9% ... 但你仔细想想其实它什么都没说, 作为一个经济门外汉几乎无法从中得出对自己有意义的信息.\n\n直到有位答主贴了一张图:\n\n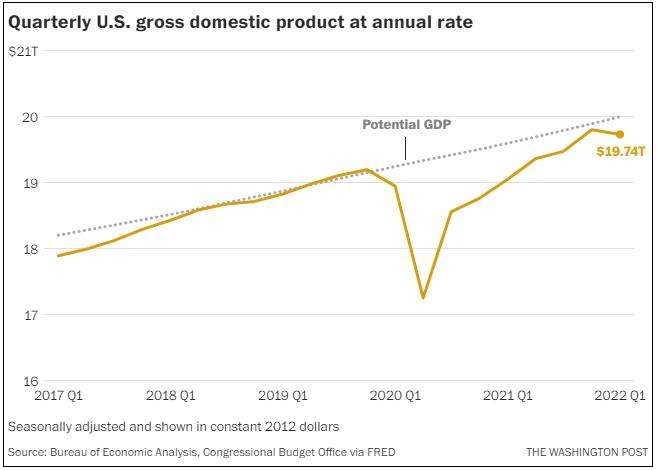\n\n通过这张图, 读者几乎可以在一秒之内就了解近三年美国的 GDP 变化.", | |
| "metadata": {}, | |
| "id": "790a420f-3515-4511-9ba8-112750d1da89" | |
| }, | |
| { | |
| "cell_type": "markdown", | |
| "source": "## 一图胜千言\n\n\"A picture is worth a thousand words.\"\n\n许多重要人物都发表过类似的观点, 例如拿破仑曾经说过, \"A good sketch is better than a long speech\". 同时 1913 年在俄亥俄州 Piqua 的 Piqua Auto Supply House 的一份报纸广告中, 出现了类似理念:\n\n\n\n- 我们在视觉上学习和记忆.\n- 视觉智商的增长速度快于其他形式的智商.\n- 带有图片的文字影响更大. 在研究演示文稿的类型时, 明尼苏达大学和 3M 的研究人员发现, 包含\"良好\"图形的演示文稿的说服力比纯文本演示文稿高 43%.\n- 我们没有时间阅读. 尼尔森·诺曼小组研究了用户在网络上的阅读方式, 发现用户仅阅读页面内容的 25%.\n- 图表可以在更短的时间内传达更多信息.\n- 视觉信息突破了语言障碍.\n- 图表有助于设计和规划. 尤其是在研究经济问题, 或者对链上数据进行分析时.\n- 图表适合所有人.", | |
| "metadata": {}, | |
| "id": "5cd1f242-b8ca-4736-886c-7aff650c862b" | |
| }, | |
| { | |
| "cell_type": "markdown", | |
| "source": "## Matplotlib 安利\n\nMatplotlib 是一个 Python 绘图库. 无论是技术人员还是非技术人员, 都可以在短时间内快速上手.\n\nPython 有一些云端执行环境, 这意味着你可以完全不安装任何软件就能体验到 Matplotlib 的强大! [https://jupyter.org/try-jupyter/lab/](https://jupyter.org/try-jupyter/lab/)", | |
| "metadata": {}, | |
| "id": "2883c9d6-e853-47e8-9597-7c7f5c5fa5f2" | |
| }, | |
| { | |
| "cell_type": "markdown", | |
| "source": "## 折线图", | |
| "metadata": { | |
| "tags": [] | |
| }, | |
| "id": "800be9d5-f8bd-4765-850b-2c69a4653726" | |
| }, | |
| { | |
| "cell_type": "markdown", | |
| "source": "**绘制折线图**", | |
| "metadata": {}, | |
| "id": "5058e57c-6cf3-48c7-806b-4032877a2c3f" | |
| }, | |
| { | |
| "cell_type": "code", | |
| "source": "import matplotlib.pyplot as plt\n\nx = [1, 2, 3, 4]\ny = [2, 4, 6, 8]\n\nplt.plot(x, y)\nplt.show()", | |
| "metadata": {}, | |
| "execution_count": null, | |
| "outputs": [], | |
| "id": "5a44dd64-3f49-40e6-86f3-8838fe0d7552" | |
| }, | |
| { | |
| "cell_type": "markdown", | |
| "source": "**皮肤**\n\nMatplotlib 默认的皮肤比较寡淡, 我一般喜欢使用 seaborn 皮肤.", | |
| "metadata": {}, | |
| "id": "4c03bc23-9f4f-4eb3-a7bf-e99bcdecb0fc" | |
| }, | |
| { | |
| "cell_type": "code", | |
| "source": "import numpy as np\nimport matplotlib.pyplot as plt\nplt.style.use('seaborn')\n\nx = np.linspace(-np.pi, np.pi, 256)\ny = np.sin(x)\n\nplt.plot(x, y)\nplt.show()", | |
| "metadata": {}, | |
| "execution_count": null, | |
| "outputs": [], | |
| "id": "4bab5ae8-7861-4e73-a97d-e140f1b5fadb" | |
| }, | |
| { | |
| "cell_type": "markdown", | |
| "source": "**折线样式**", | |
| "metadata": {}, | |
| "id": "ef47b0cf-609f-4a75-95a1-5efa4b03d8a8" | |
| }, | |
| { | |
| "cell_type": "code", | |
| "source": "import numpy as np\nimport matplotlib.pyplot as plt\nplt.style.use('seaborn')\n\nx = np.linspace(-np.pi, np.pi, 256)\ny = np.sin(x)\n\nplt.plot(x, y, color='pink', linewidth=2, linestyle='--')\nplt.show()", | |
| "metadata": {}, | |
| "execution_count": null, | |
| "outputs": [], | |
| "id": "dfb03734-1b0a-46e4-a810-ac7ef510577b" | |
| }, | |
| { | |
| "cell_type": "markdown", | |
| "source": "**填充**\n\n需要对数据进行积分的时候采用. 例如我们要去统计过去 12 个月内每个月 CKB 的 DAO 内的新增存款.", | |
| "metadata": {}, | |
| "id": "a9dec55a-46ab-41fd-9661-4cf9d7b491a6" | |
| }, | |
| { | |
| "cell_type": "code", | |
| "source": "import numpy as np\nimport matplotlib.pyplot as plt\nplt.style.use('seaborn')\n\nx = np.linspace(-np.pi, np.pi, 256)\ny = np.sin(x)\n# 参数以 .plot 相似, 区别是会填充曲线的面积, 填充分界线为 y=c(c 为 x = 0 时的数)\n# alpha 为透明度\nplt.fill(x, np.sin(x), alpha=0.5)\nplt.show()", | |
| "metadata": {}, | |
| "execution_count": null, | |
| "outputs": [], | |
| "id": "53dc27e9-c9d9-4ca0-8c4e-bdaa8b6e3ff2" | |
| }, | |
| { | |
| "cell_type": "markdown", | |
| "source": "**坐标位置与坐标样式**\n\n处理数学问题的时候偶尔会用到, 比如绘制椭圆曲线.", | |
| "metadata": {}, | |
| "id": "962fa258-3a2c-484b-8df9-87ccf6c56cc7" | |
| }, | |
| { | |
| "cell_type": "code", | |
| "source": "import numpy as np\nimport matplotlib.pyplot as plt\nplt.style.use('seaborn')\n\nx = np.linspace(-np.pi, np.pi, 256)\ny = np.sin(x)\nax = plt.subplot()\nax.plot(x, y)\n\n# 移动坐标轴与设置坐标轴样式\nax.spines['bottom'].set_color('#646882')\nax.spines['bottom'].set_linewidth(1)\nax.spines['bottom'].set_position(('data', 0))\nax.spines['left'].set_color('#646882')\nax.spines['left'].set_linewidth(1)\nax.spines['left'].set_position(('data', 0))\n\nplt.show()", | |
| "metadata": {}, | |
| "execution_count": null, | |
| "outputs": [], | |
| "id": "8287198f-422a-43c6-a668-17fcabea662a" | |
| }, | |
| { | |
| "cell_type": "markdown", | |
| "source": "**添加函数名称**", | |
| "metadata": {}, | |
| "id": "9a7d00d0-625a-42d7-9b98-6cea47731865" | |
| }, | |
| { | |
| "cell_type": "code", | |
| "source": "import numpy as np\nimport matplotlib.pyplot as plt\nplt.style.use('seaborn')\n\nx = np.linspace(-np.pi, np.pi, 256)\ny = np.sin(x)\n\n# 为曲线添加名称\nplt.plot(x, y, label='sin(x)')\nplt.legend(loc='lower right')\nplt.show()", | |
| "metadata": {}, | |
| "execution_count": null, | |
| "outputs": [], | |
| "id": "a3299abf-27b4-4dfc-96a9-a36374d9f9c4" | |
| }, | |
| { | |
| "cell_type": "markdown", | |
| "source": "## 散点图\n\n主要用于处理离散数据.", | |
| "metadata": {}, | |
| "id": "88c6e8ae-d687-42f2-bd82-6917c3842716" | |
| }, | |
| { | |
| "cell_type": "code", | |
| "source": "import numpy as np\nimport matplotlib.pyplot as plt\nplt.style.use('seaborn')\n\nx = np.linspace(-np.pi, np.pi, 16)\ny = np.sin(x)\n\n# s: 散点大小, 默认 20\n# c: 颜色\n# alpha: 透明度\nplt.scatter(x, y, s=50, c='#FF0000', alpha=0.5)\nplt.show()", | |
| "metadata": {}, | |
| "execution_count": null, | |
| "outputs": [], | |
| "id": "264c553a-9387-4b7f-838c-55ff40af0565" | |
| }, | |
| { | |
| "cell_type": "markdown", | |
| "source": "**样式**", | |
| "metadata": {}, | |
| "id": "faf9977f-3e47-4841-a142-28c6dead9043" | |
| }, | |
| { | |
| "cell_type": "code", | |
| "source": "import numpy as np\nimport matplotlib.pyplot as plt\nplt.style.use('seaborn')\n\nx = np.linspace(-np.pi, np.pi, 16)\ny = np.sin(x)\n\nplt.scatter(x, y, s=50, c='#FF0000', marker='+', alpha=0.5)\nplt.show()", | |
| "metadata": {}, | |
| "execution_count": null, | |
| "outputs": [], | |
| "id": "614dd17f-3933-4ec8-8809-20ec6ebfc25e" | |
| }, | |
| { | |
| "cell_type": "markdown", | |
| "source": "**三维坐标**", | |
| "metadata": {}, | |
| "id": "9dd53fcf-e1c3-471d-b572-dd54825b5e08" | |
| }, | |
| { | |
| "cell_type": "code", | |
| "source": "import matplotlib.pyplot as plt\nfrom mpl_toolkits.mplot3d import Axes3D\nimport numpy as np\nplt.style.use('seaborn')\n\np = plt.subplot(projection='3d')\n\nx = np.linspace(-np.pi, np.pi, 16)\ny = np.sin(x)\nz = np.linspace(-np.pi, np.pi, 16)\n\np.scatter(x, y, z, s=50, c='#FF0000', alpha=0.5)\np.set_zlabel('Z')\np.set_ylabel('Y')\np.set_xlabel('X')\nplt.show()", | |
| "metadata": {}, | |
| "execution_count": null, | |
| "outputs": [], | |
| "id": "57ec20dc-7fb6-4710-b670-e588b97330f4" | |
| }, | |
| { | |
| "cell_type": "markdown", | |
| "source": "## 柱状图", | |
| "metadata": {}, | |
| "id": "47e42544-995b-44e2-b907-dcf29f3384ba" | |
| }, | |
| { | |
| "cell_type": "code", | |
| "source": "import numpy as np\nimport matplotlib.pyplot as plt\nplt.style.use('seaborn')\n\nX = np.arange(5) + 1\nY = np.array([0.5, 0.67, 0.71, 0.56, 0.8])\n\n\nplt.bar(X, Y, tick_label=['I', 'II', 'III', 'IV', 'V'])\n# 在柱状图上标记 y 轴大小\nfor x, y in zip(X, Y):\n plt.text(x, y, f'{y:.2}', ha='center', va='bottom')\n\nplt.show()", | |
| "metadata": {}, | |
| "execution_count": null, | |
| "outputs": [], | |
| "id": "d63514f2-b4fb-4a83-97cf-c51d20b90003" | |
| }, | |
| { | |
| "cell_type": "markdown", | |
| "source": "**柱状图柱子的颜色**\n\nplt.bar 函数的 color 参数可以设置颜色; color 可以接受一个颜色, 也可以接受一个颜色数组", | |
| "metadata": {}, | |
| "id": "1e9d5432-04e8-40db-b412-d60380ab19f4" | |
| }, | |
| { | |
| "cell_type": "code", | |
| "source": "import numpy as np\nimport matplotlib.pyplot as plt\nplt.style.use('seaborn')\n\nX = np.arange(5) + 1\nY = np.array([0.5, 0.67, 0.71, 0.56, 0.8])\n\n\nplt.bar(X, Y, tick_label=['I', 'II', 'III', 'IV', 'V'], color=['pink', 'purple'])\n# 在柱状图上标记 y 轴大小\nfor x, y in zip(X, Y):\n plt.text(x, y, f'{y:.2}', ha='center', va='bottom')\n\nplt.show()", | |
| "metadata": {}, | |
| "execution_count": null, | |
| "outputs": [], | |
| "id": "ecfb7f83-6624-4266-9672-729dafffbede" | |
| }, | |
| { | |
| "cell_type": "markdown", | |
| "source": "**填充**\n\nplt.bar 函数的 hatch 参数可以填充样式, 可取值为: `/`, `\\`, `|`, `-`, `+`, `x`, `o`, `O`, `.`, `*`", | |
| "metadata": {}, | |
| "id": "d21a9921-46d2-4a64-874f-e835446305c5" | |
| }, | |
| { | |
| "cell_type": "code", | |
| "source": "import numpy as np\nimport matplotlib.pyplot as plt\nplt.style.use('seaborn')\n\nX = np.arange(5) + 1\nY = np.array([0.5, 0.67, 0.71, 0.56, 0.8])\n\n\nplt.bar(X, Y, tick_label=['I', 'II', 'III', 'IV', 'V'], hatch='/')\n# 在柱状图上标记 y 轴大小\nfor x, y in zip(X, Y):\n plt.text(x, y, f'{y:.2}', ha='center', va='bottom')\n\nplt.show()", | |
| "metadata": {}, | |
| "execution_count": null, | |
| "outputs": [], | |
| "id": "71931bd1-75b5-4cac-bd6d-dea9e0c5766d" | |
| }, | |
| { | |
| "cell_type": "markdown", | |
| "source": "**柱状图堆叠**\n\n使用 bottom 参数堆叠柱状图", | |
| "metadata": {}, | |
| "id": "ab6d5441-eef6-437f-ad75-021890c1d0e8" | |
| }, | |
| { | |
| "cell_type": "code", | |
| "source": "import numpy as np\nimport matplotlib.pyplot as plt\nplt.style.use('seaborn')\n\nX = np.arange(5) + 1\nY1 = np.array([0.5, 0.67, 0.71, 0.56, 0.8])\nY2 = np.random.random(5)\n\nplt.bar(X, Y1, tick_label=['I', 'II', 'III', 'IV', 'V'], label='Y1')\nplt.bar(X, Y2, bottom=Y1, label='Y2')\n\nplt.legend()\nplt.show()", | |
| "metadata": {}, | |
| "execution_count": null, | |
| "outputs": [], | |
| "id": "60be7e11-67e5-4b30-ad78-e5fa530707cf" | |
| }, | |
| { | |
| "cell_type": "markdown", | |
| "source": "**柱状图并列**\n\n设置柱状图的 bar_width 实现柱状图并列", | |
| "metadata": {}, | |
| "id": "a15a689f-1eae-42bc-8336-92e33f759ada" | |
| }, | |
| { | |
| "cell_type": "code", | |
| "source": "import numpy as np\nimport matplotlib.pyplot as plt\nplt.style.use('seaborn')\n\nbar_width = 0.8 / 2\n\nX1 = np.arange(5) + 1\nY1 = np.random.random(5)\nX2 = X1 + bar_width\nY2 = np.random.random(5)\n\nplt.bar(X1, Y1, bar_width)\nplt.bar(X2, Y2, bar_width)\nplt.xticks(X1+bar_width / 2, ['I', 'II', 'III', 'IV', 'V'])\nplt.show()", | |
| "metadata": {}, | |
| "execution_count": null, | |
| "outputs": [], | |
| "id": "f1f181f6-07ed-4b53-a053-b337b442ef03" | |
| }, | |
| { | |
| "cell_type": "markdown", | |
| "source": "**条状图**\n\n条状图与柱状图基本类似. 经常用于对候选人进行计票.", | |
| "metadata": {}, | |
| "id": "5bb71331-a4f7-4a18-b626-c1f6e63ad0d3" | |
| }, | |
| { | |
| "cell_type": "code", | |
| "source": "import numpy as np\nimport matplotlib.pyplot as plt\nplt.style.use('seaborn')\n\nX = np.arange(5) + 1\nY = np.random.random(5)\n\np = plt.subplot()\np.barh(X, Y)\np.set_yticks(X)\np.set_yticklabels(['I', 'II', 'III', 'IV', 'V'])\n\nplt.show()", | |
| "metadata": {}, | |
| "execution_count": null, | |
| "outputs": [], | |
| "id": "122ed443-911e-4053-8db5-69cec53cbb4e" | |
| }, | |
| { | |
| "cell_type": "markdown", | |
| "source": "## 饼图\n\n**饼图**", | |
| "metadata": {}, | |
| "id": "5cbd6535-a437-4598-96aa-c376cdbbfc1b" | |
| }, | |
| { | |
| "cell_type": "code", | |
| "source": "import matplotlib.pyplot as plt\nplt.style.use('seaborn')\n\nX = [15, 30, 45, 10]\nlabels = 'I', 'II', 'III', 'IV'\n\nplt.pie(X, labels=labels, autopct='%1.1f%%', startangle=90)\nplt.show()", | |
| "metadata": {}, | |
| "execution_count": null, | |
| "outputs": [], | |
| "id": "4c2f09d0-d9c1-45b6-bc4d-6867287b3ec4" | |
| }, | |
| { | |
| "cell_type": "markdown", | |
| "source": "**饼图部分强调**", | |
| "metadata": {}, | |
| "id": "8b6d08f0-ff0c-466b-bc0c-d8bc8b279284" | |
| }, | |
| { | |
| "cell_type": "code", | |
| "source": "import matplotlib.pyplot as plt\nplt.style.use('seaborn')\n\nX = [15, 30, 45, 10]\nlabels = 'I', 'II', 'III', 'IV'\nexplode = [0, 0.1, 0, 0]\n\n# explode 参数可以强调数据\nplt.pie(X, explode=explode, labels=labels, autopct='%1.1f%%', startangle=90)\nplt.axis('equal')\nplt.show()", | |
| "metadata": {}, | |
| "execution_count": null, | |
| "outputs": [], | |
| "id": "13df9f0e-b7b6-43c7-a6bd-c0fe4ee2980e" | |
| }, | |
| { | |
| "cell_type": "markdown", | |
| "source": "## 配色\n\n我们可以做一些更好的事情来保护读者的眼睛, 比如用比较齁人的马卡龙色\n\n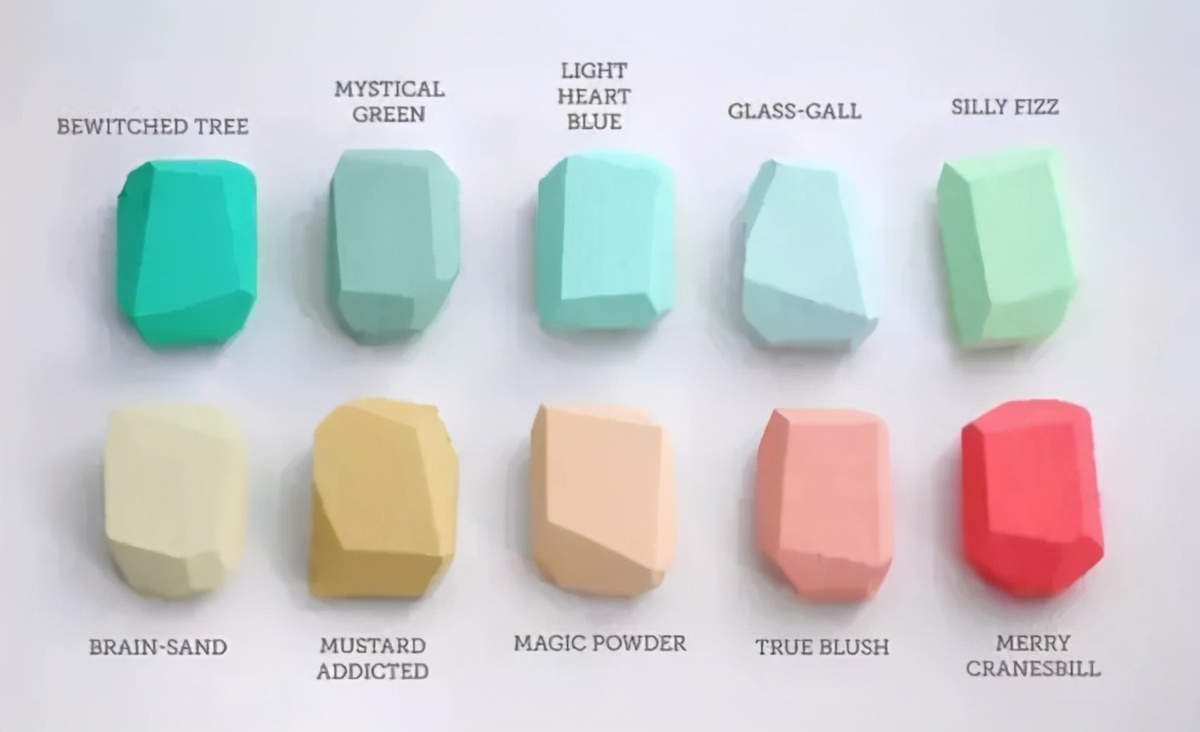\n\n- <code style=\"color: #19CAAD; background-color: #19CAAD\">#19CAAD</code> `#19CAAD`\n- <code style=\"color: #8CC7B5; background-color: #8CC7B5\">#8CC7B5</code> `#8CC7B5`\n- <code style=\"color: #A0EEE1; background-color: #A0EEE1\">#A0EEE1</code> `#A0EEE1`\n- <code style=\"color: #BEE7E9; background-color: #BEE7E9\">#BEE7E9</code> `#BEE7E9`\n- <code style=\"color: #BEEDC7; background-color: #BEEDC7\">#BEEDC7</code> `#BEEDC7`\n- <code style=\"color: #D6D5B7; background-color: #D6D5B7\">#D6D5B7</code> `#D6D5B7`\n- <code style=\"color: #D1BA74; background-color: #D1BA74\">#D1BA74</code> `#D1BA74`\n- <code style=\"color: #E6CEAC; background-color: #E6CEAC\">#E6CEAC</code> `#E6CEAC`\n- <code style=\"color: #ECAD9E; background-color: #ECAD9E\">#ECAD9E</code> `#ECAD9E`\n- <code style=\"color: #F4606C; background-color: #F4606C\">#F4606C</code> `#F4606C`\n", | |
| "metadata": {}, | |
| "id": "110ac700-66f5-40c3-958f-54ecc5262091" | |
| }, | |
| { | |
| "cell_type": "code", | |
| "source": "", | |
| "metadata": {}, | |
| "execution_count": null, | |
| "outputs": [], | |
| "id": "8d7486c8-d19b-44d4-beab-d1f3547d88e1" | |
| } | |
| ] | |
| } |
Sign up for free
to join this conversation on GitHub.
Already have an account?
Sign in to comment