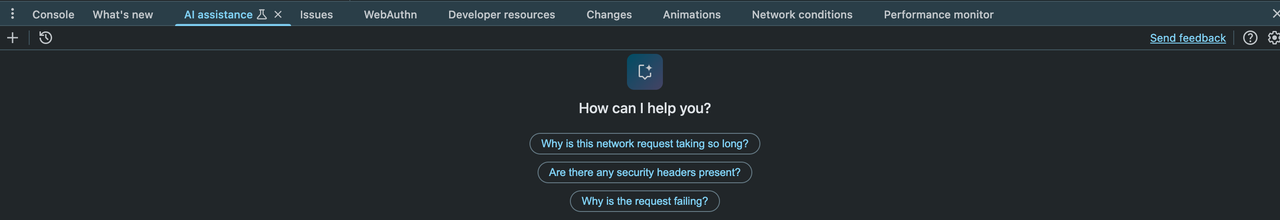
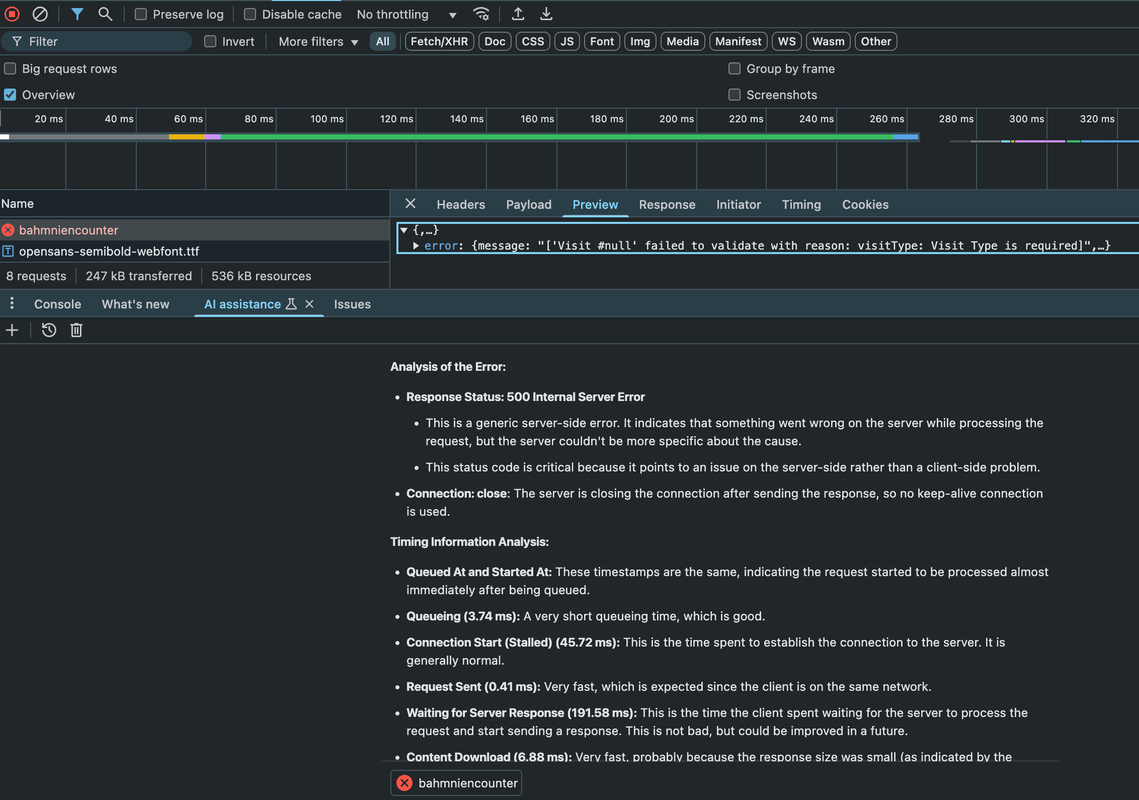
As a QA professional, debugging complex issues is part of my daily routine. Today, I explored the AI Assistance Panel in Chrome DevTools while troubleshooting a 500 Internal Server Error, and I must say—it’s a powerful tool that accelerates debugging!
📌 A built-in AI tool in Google Chrome DevTools that helps analyze network requests, logs, and errors in real time.
📌 Provides structured insights and suggestions for debugging issues.
📌 Speeds up troubleshooting by identifying possible root causes.
✅ Error Analysis: Identified that the 500 error was server-side, not client-side.
✅ Validation Insight: Highlighted a missing required field (visitType) in the request payload.
✅ Timing Breakdown: Analyzed request delays, ruling out client-side performance bottlenecks.
✅ Actionable Fixes: Suggested reviewing server logs, database integrity, and API validation rules to pinpoint the root cause.
Want to try it yourself? Here’s how to enable it:
1️⃣ Open Chrome DevTools (F12 or Ctrl + Shift + I).
2️⃣ Click on Settings (⚙️) in the top-right corner.
3️⃣ Navigate to Preferences > Appearance > Language and make sure English is selected.
4️⃣ Scroll down and enable "AI Innovations" under DevTools settings.
5️⃣ Restart DevTools, and you’ll see the AI Assistance Panel in the Console & Network tabs!
🔍 Faster debugging with AI-powered insights.
⚡ Reduces time spent manually analyzing logs.
💡 Acts as a knowledge assistant, offering best practices for troubleshooting.
While AI doesn’t replace manual debugging, it significantly speeds up the investigation process! Looking forward to seeing how this tool evolves.
📖 Google Chrome DevTools Official Documentation
📖 Debugging with Chrome DevTools
📖 Google AI Innovations
#QA #Testing #AIinTesting #GoogleDevTools #Debugging #BugHunting #SoftwareTesting #Automation #QualityAssurance