Created
August 17, 2022 17:39
-
-
Save dirediredock/a22d16b871425f142fae0c3976d0aef1 to your computer and use it in GitHub Desktop.
This file contains hidden or bidirectional Unicode text that may be interpreted or compiled differently than what appears below. To review, open the file in an editor that reveals hidden Unicode characters.
Learn more about bidirectional Unicode characters
| # by Matias I. Bofarull Oddo - 2022.08.16 | |
| # Pisano Cycle: https://oeis.org/A161553 | |
| # Pisano Period: https://oeis.org/A001175 | |
| import numpy as np | |
| import matplotlib.pyplot as plt | |
| def pisano_cycle_and_period(modulus): | |
| cycle = [0, 1, 1] | |
| if modulus <= 1: | |
| return [0], 0 | |
| else: | |
| previous = cycle[1] | |
| current = cycle[2] % modulus | |
| while previous != 0 or current != 1: | |
| previous, current = current, (previous + current) % modulus | |
| cycle.append(current) | |
| return cycle[:-2], len(cycle[:-2]) | |
| def circle_XY(num_points): | |
| X = [] | |
| Y = [] | |
| for theta in np.linspace(0, np.pi * 2, num_points, endpoint=False): | |
| X.append(np.cos(theta - (np.pi / 2))) | |
| Y.append(np.sin(theta - (np.pi / 2))) | |
| return [X, Y] | |
| def ouroboros(circle_points): | |
| circle_points[0].append(circle_points[0][0]) | |
| circle_points[1].append(circle_points[1][0]) | |
| return circle_points | |
| for i in range(100): | |
| MODULO = i + 1 | |
| pisano_cycle, pisano_period = pisano_cycle_and_period(MODULO) | |
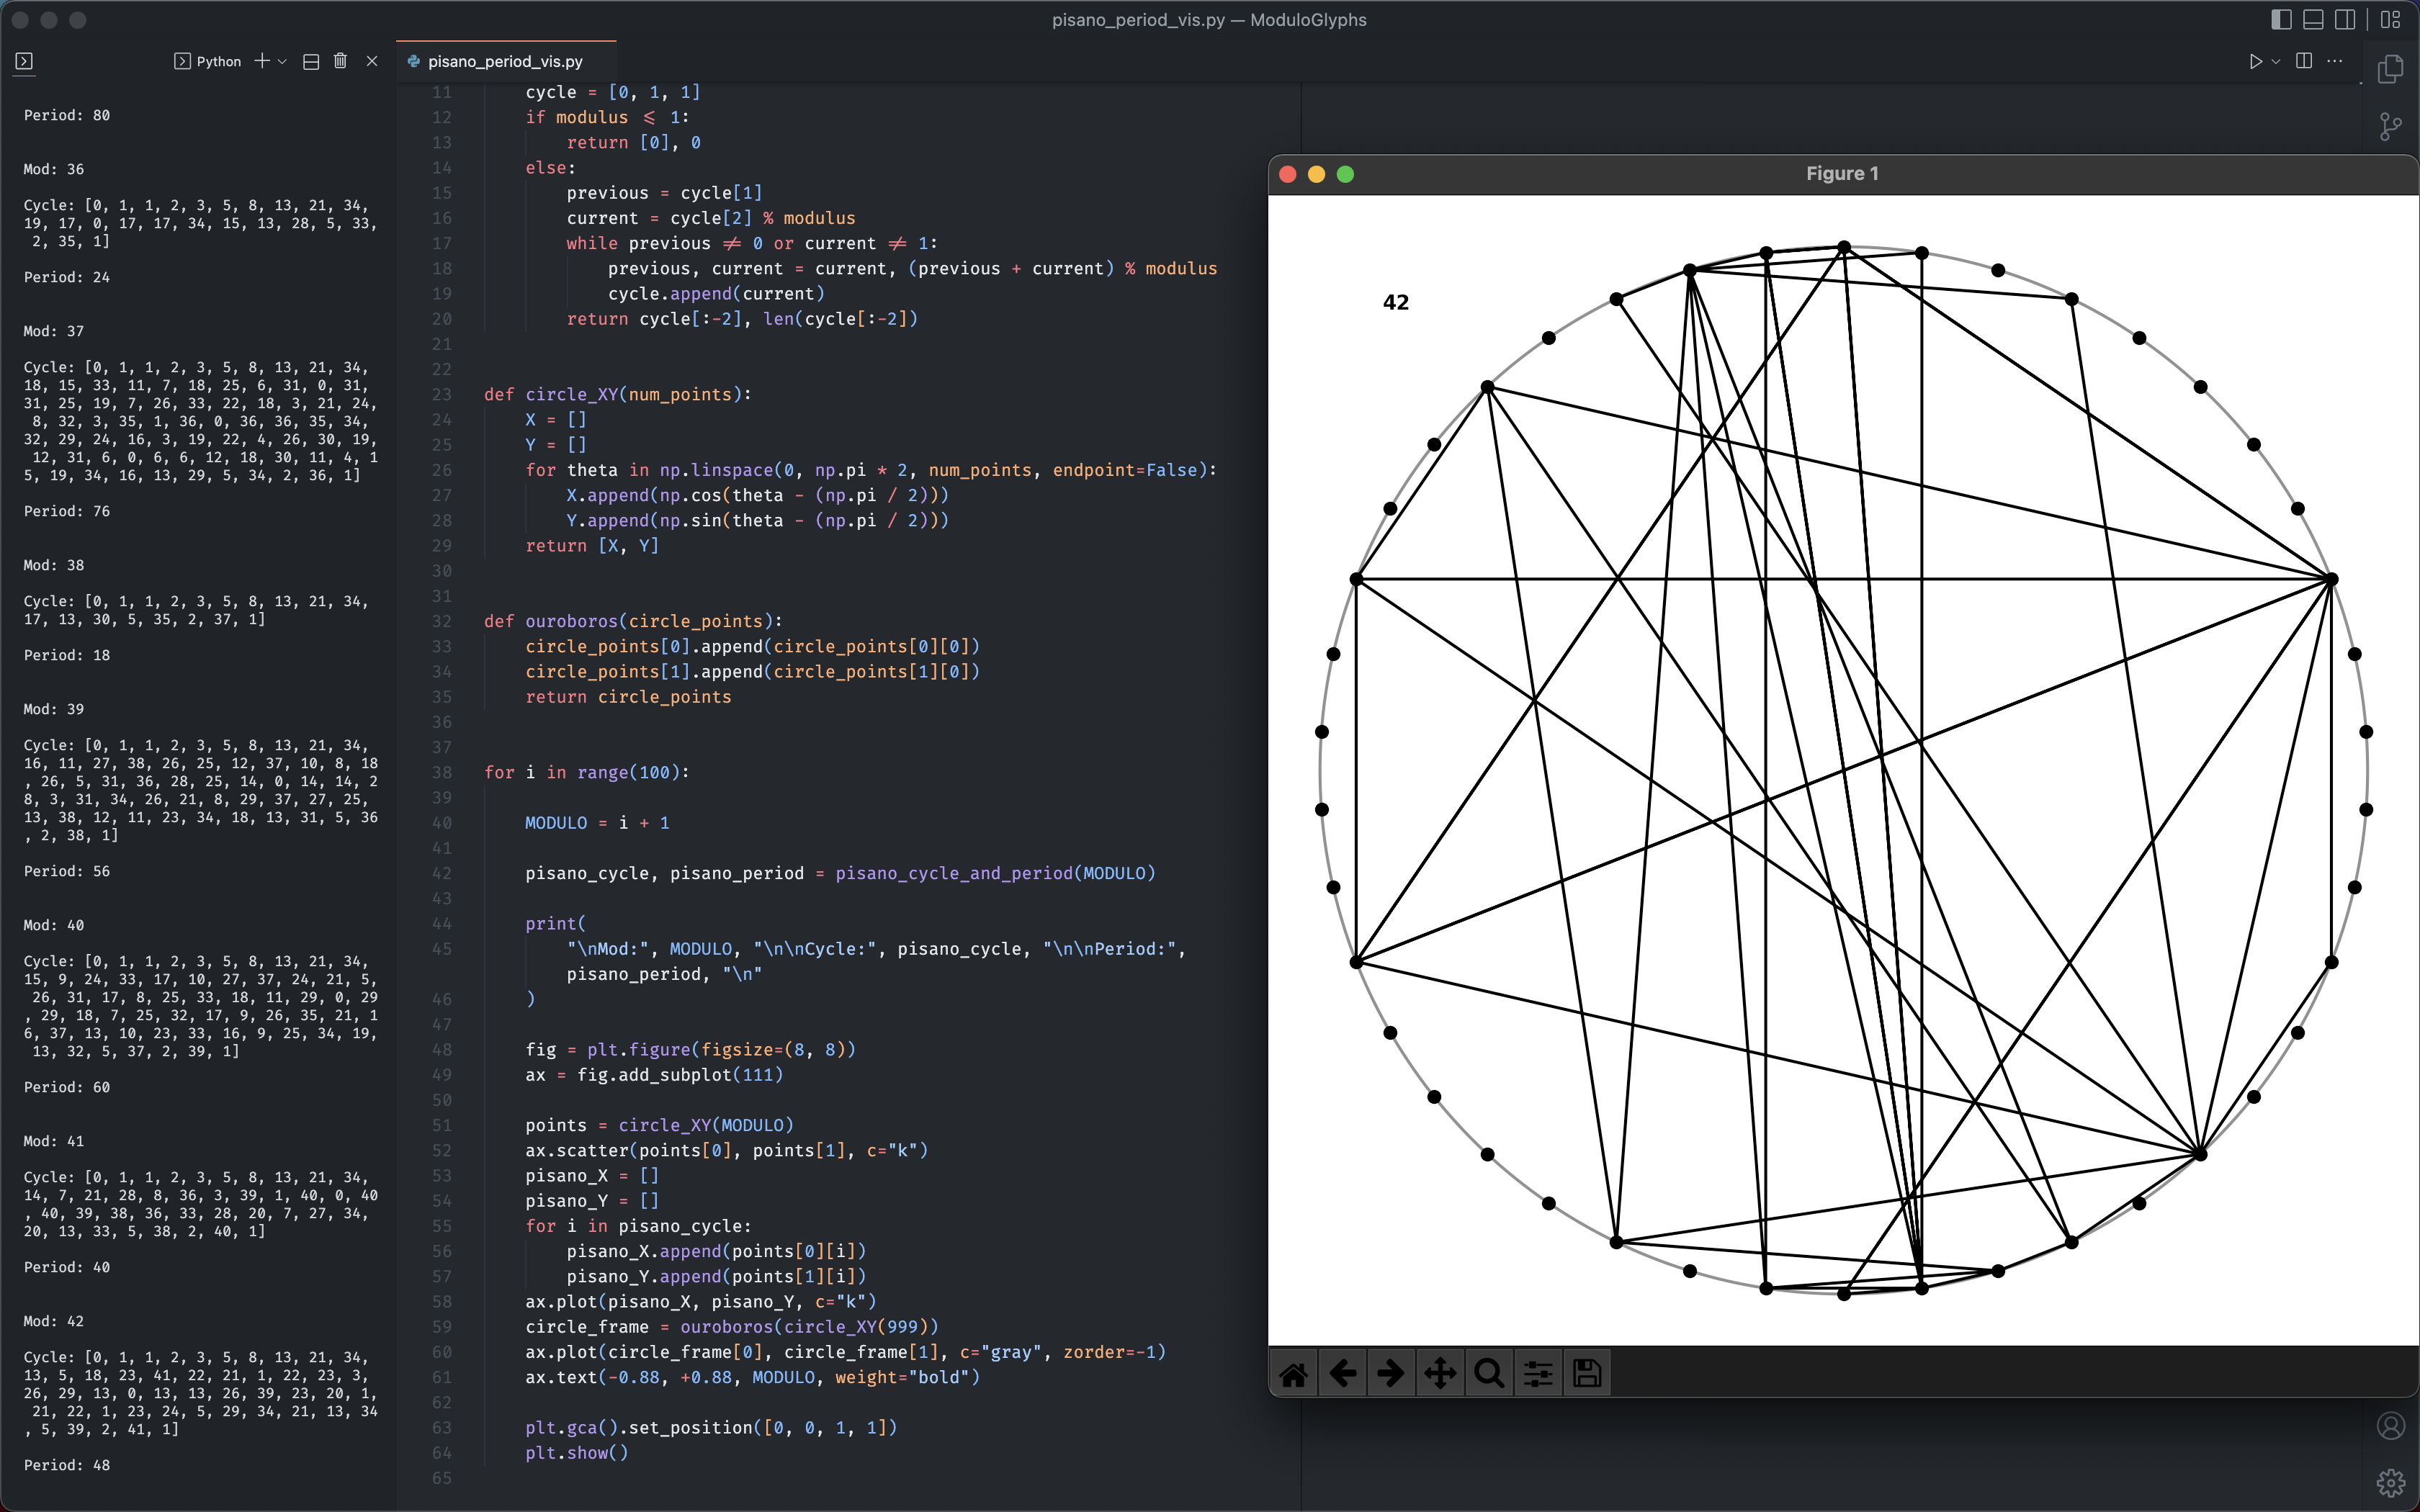
| print( | |
| "\nMod:", MODULO, "\n\nCycle:", pisano_cycle, "\n\nPeriod:", pisano_period, "\n" | |
| ) | |
| fig = plt.figure(figsize=(8, 8)) | |
| ax = fig.add_subplot(111) | |
| points = circle_XY(MODULO) | |
| ax.scatter(points[0], points[1], c="k") | |
| pisano_X = [] | |
| pisano_Y = [] | |
| for i in pisano_cycle: | |
| pisano_X.append(points[0][i]) | |
| pisano_Y.append(points[1][i]) | |
| ax.plot(pisano_X, pisano_Y, c="k") | |
| circle_frame = ouroboros(circle_XY(999)) | |
| ax.plot(circle_frame[0], circle_frame[1], c="gray", zorder=-1) | |
| ax.text(-0.88, +0.88, MODULO, weight="bold") | |
| plt.gca().set_position([0, 0, 1, 1]) | |
| plt.show() |
Author
dirediredock
commented
Aug 17, 2022
Sign up for free
to join this conversation on GitHub.
Already have an account?
Sign in to comment