Matthew Kay 2023-04-21
library(ggplot2)
library(dplyr)
library(distributional)
library(ggdist)    # requires remotes::install_github("mjskay/ggdist@dev")
library(ggtext)
library(posterior)
library(tidybayes)
library(ragg)

knitr::opts_chunk$set(dev = "ragg_png", fig.retina = 2)set.seed(1234)
kde_comparison_plot = function(dists, sample_size = 100) {
tibble(
x = dists,
x_name = format(x),
x_sample = dist_sample(generate(x, sample_size))
) |>
ggplot() +
stat_slab(aes(xdist = x), fill = "gray85") +
stat_slab(aes(xdist = x_sample), color = "blue", fill = NA, density = "unbounded", alpha = 0.5) +
# stat_slab(aes(xdist = x_sample), color = "blue", fill = NA, density = "unbounded", trim = FALSE, linewidth = 0.5, alpha = 0.5) +
stat_slab(aes(xdist = x_sample), color = "red", fill = NA, alpha = 0.75, linetype = "11") +
geom_rug(aes(x = x_sample), data = \(d) d |> transmute(x_name, x_sample = as_rvar(x_sample)) |> unnest_rvars(), alpha = 0.2) +
scale_thickness_shared() +
facet_wrap(~ x_name) +
theme_ggdist() +
theme(plot.title = element_markdown(lineheight = 0.7), plot.subtitle = element_markdown(lineheight = 1.2)) +
labs(
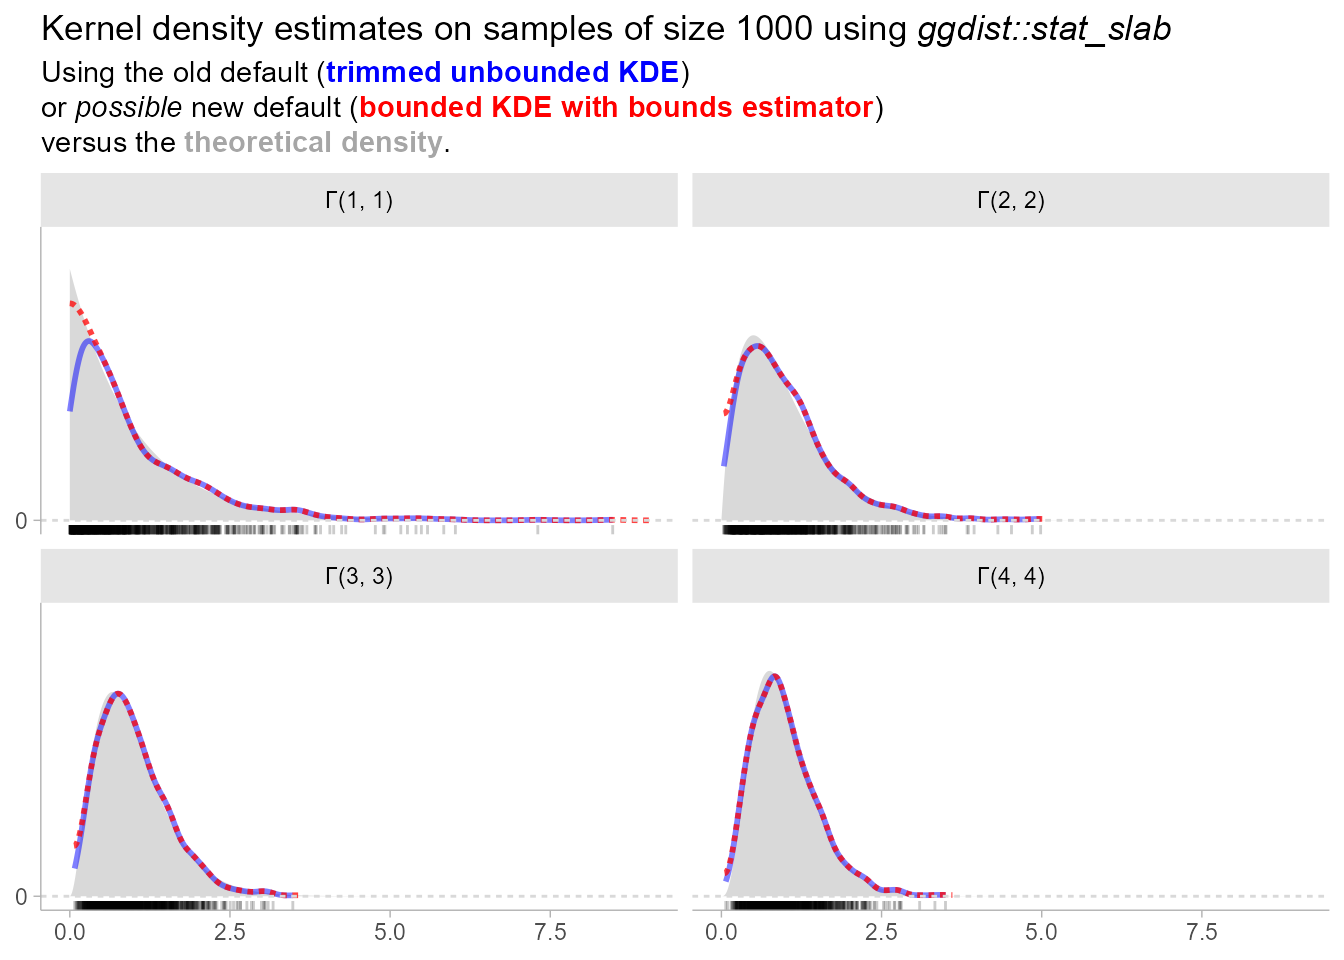
title = paste0("Kernel density estimates on samples of size ", sample_size, " using *ggdist::stat_slab*"),
subtitle =
"Using the old default (<span style='color: blue;'>**trimmed unbounded KDE**</span>)<br>
or *possible* new default (<span style='color: red;'>**bounded KDE with bounds estimator**</span>)<br>
versus the <span style='color: gray65;'>**theoretical density**</span>.",
x = NULL,
y = NULL
) +
scale_y_continuous(breaks = 0) +
geom_hline(yintercept = 0, color = "gray85", linetype = "22")
}
kde_comparison_plot(dist_beta(1:4, 1:4), 100)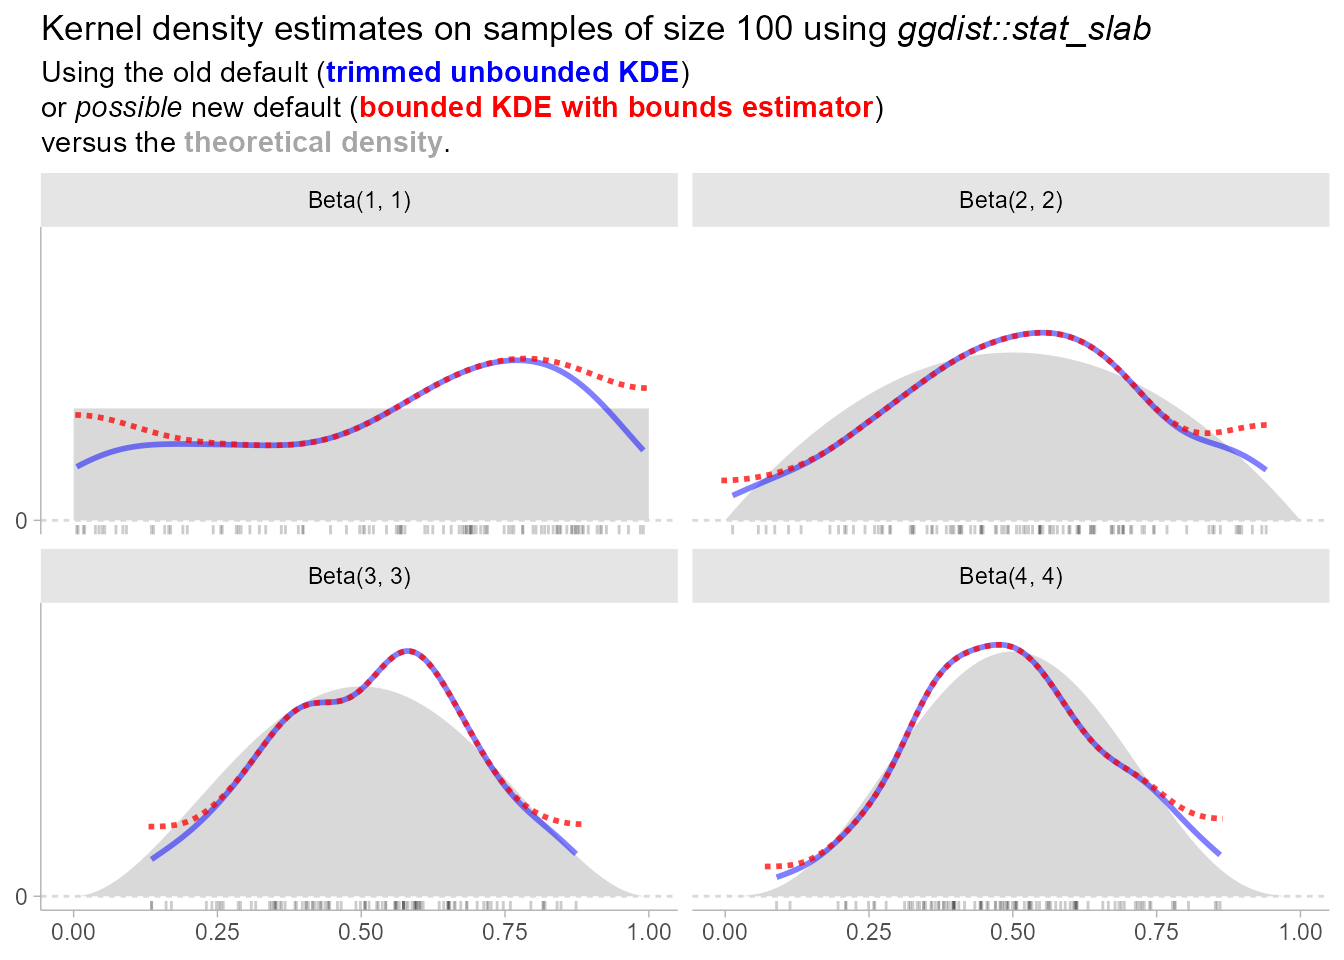
set.seed(1234)
kde_comparison_plot(dist_beta(1:4, 1:4), 1000)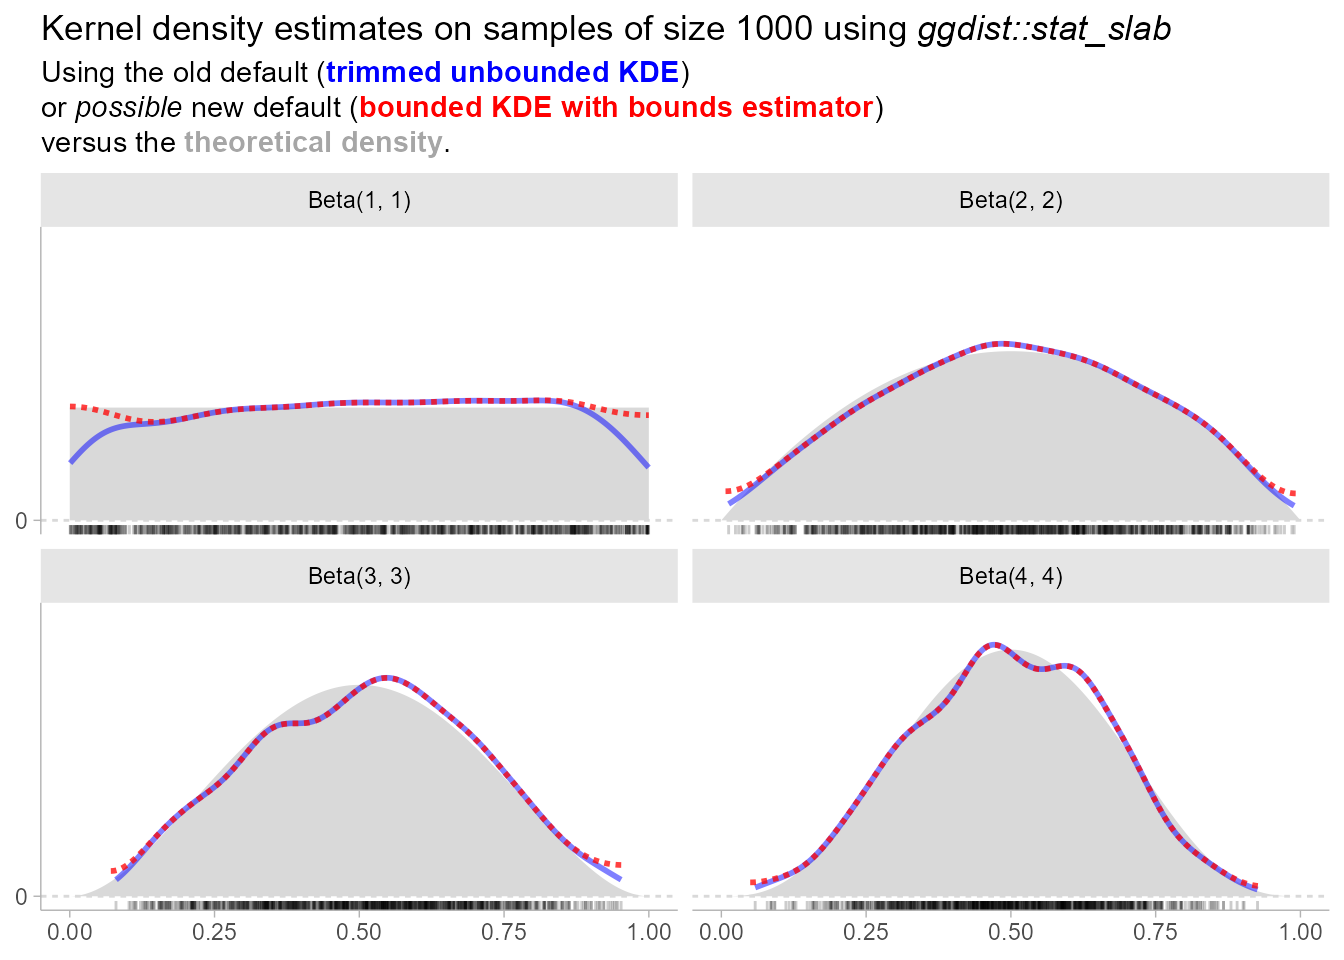
set.seed(1234)
kde_comparison_plot(dist_gamma(1:4, 1:4), 100)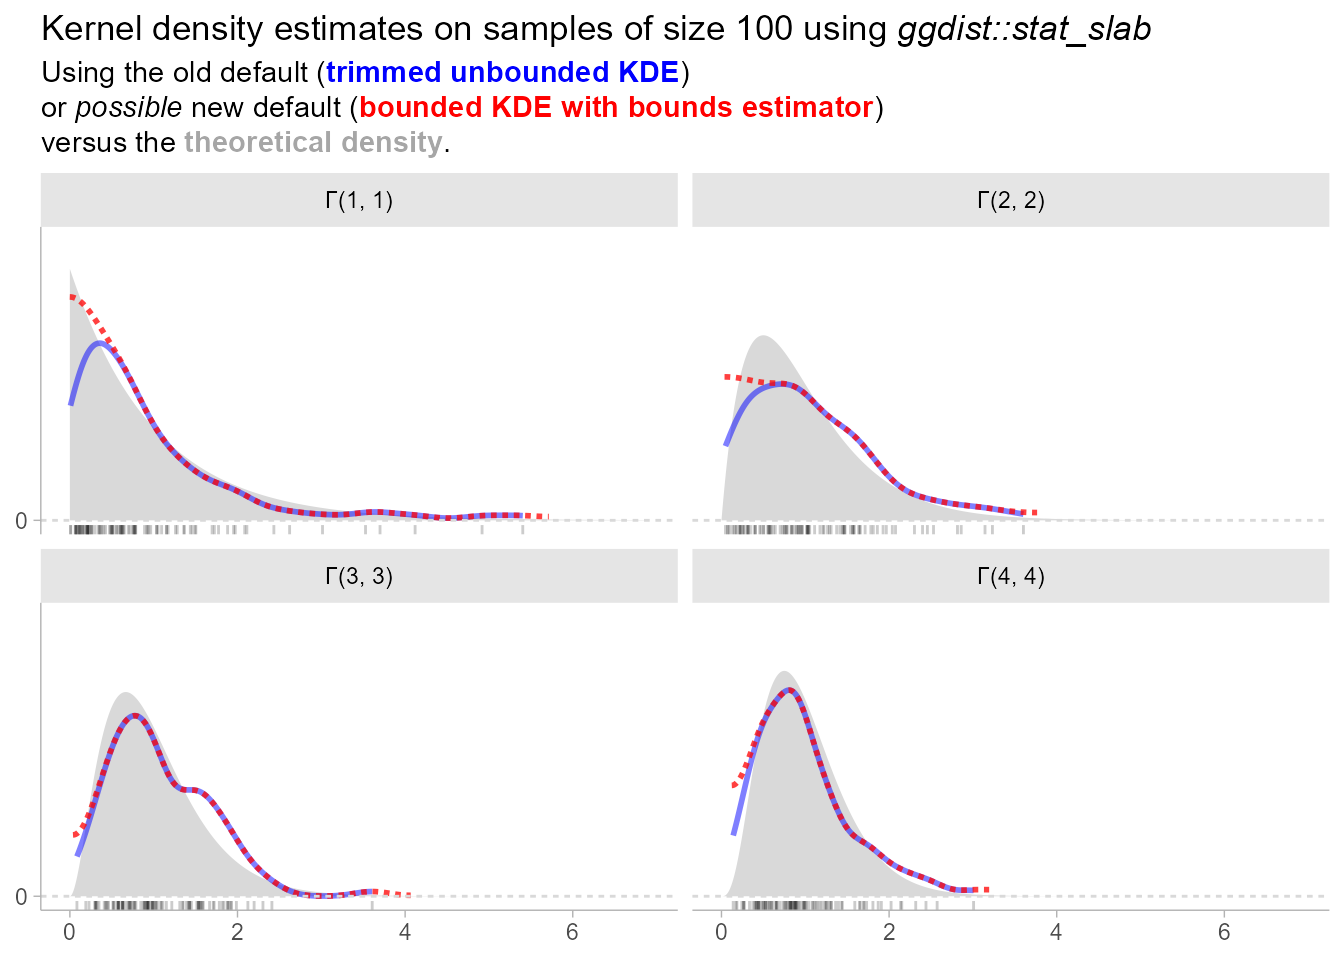
set.seed(1234)
kde_comparison_plot(dist_gamma(1:4, 1:4), 1000)